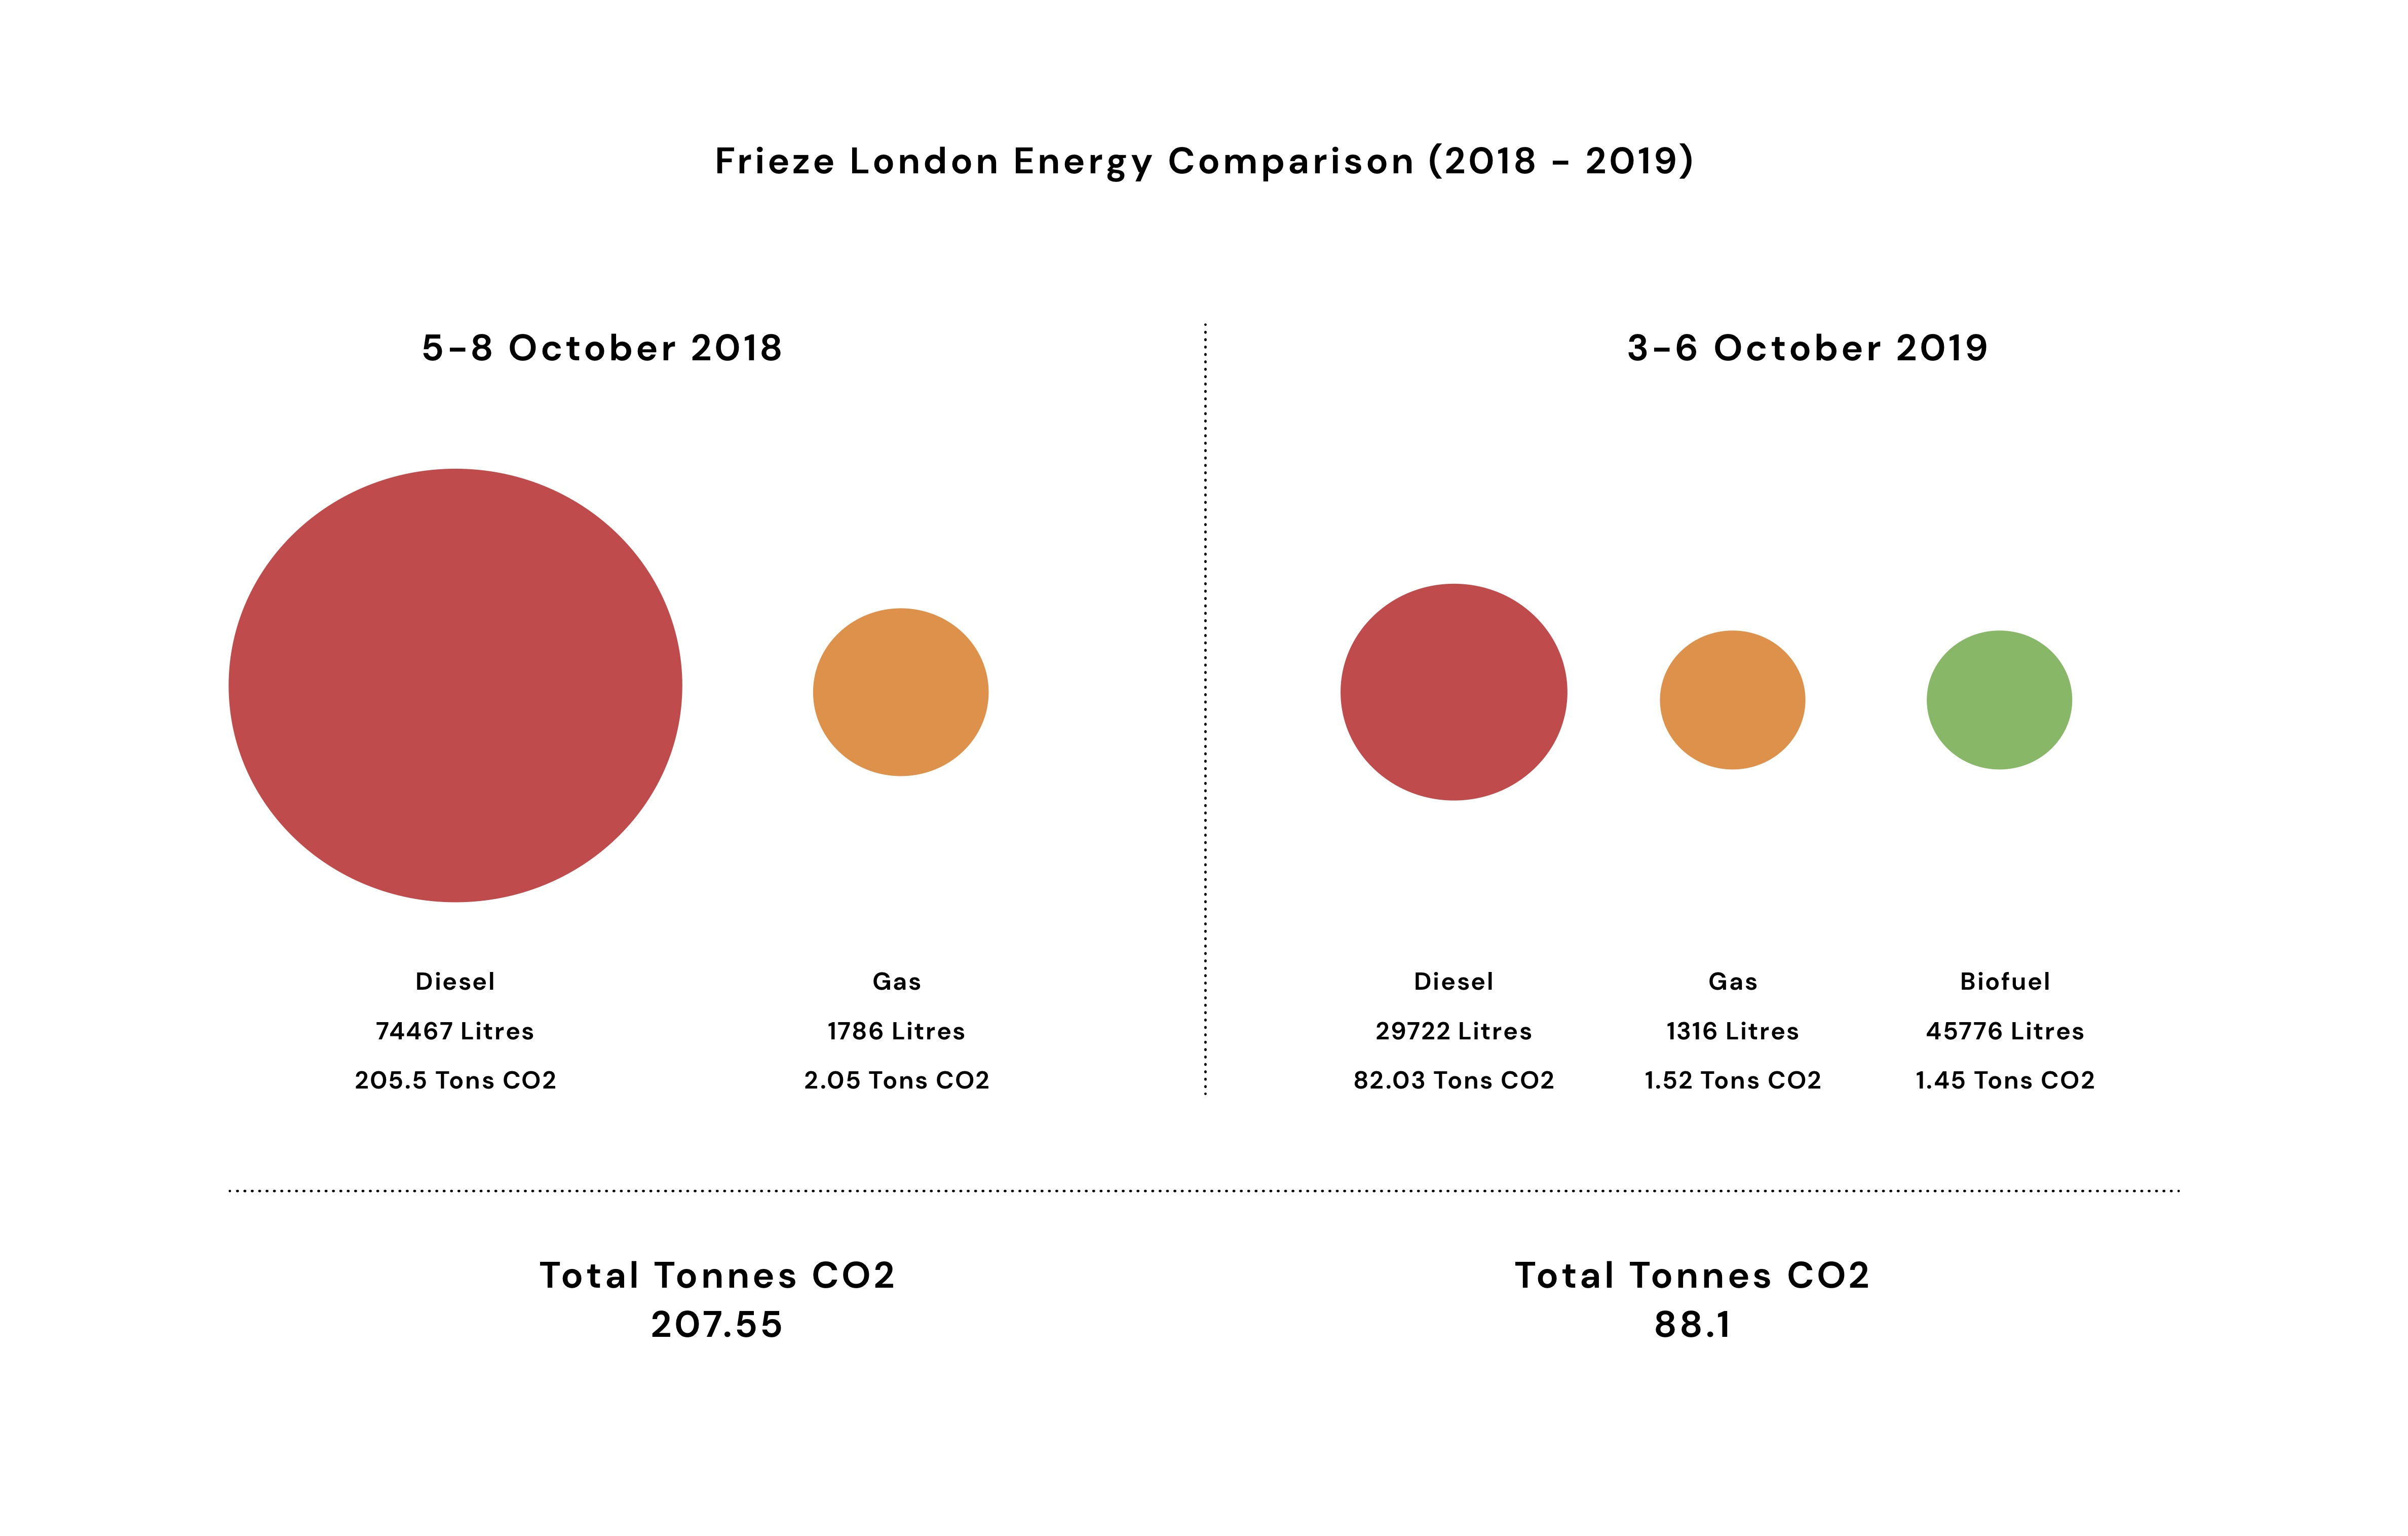
Carbon footprint of Frieze London, 2018 vs. 2019
- Hope Solutions carried out environmental audits for Scope 1 and 2 carbon emissions for Frieze London 2018 and 2019.
- They found that by far the largest contributor was the diesel fuel used to power the generators at the fair.
- In 2019 Frieze changed to HVO biofuel, reducing these emissions by 67%.
- It should be noted that these emissions are solely for Scope 1 & 2 at Frieze London, and do not include Scope 3, such as travel by Frieze staff, heating of the Frieze offices, nor any footprint of the gallery staff, artworks or visitors to the fairs.

|
|
2018 |
|
2019 |
|
|
|
Amount |
CO2 (tonnes) |
Amount |
CO2 (tonnes) |
|
Fuel |
|
|
|
|
|
Diesel |
74467 litres |
205.5 |
29722 L |
82.03 |
|
Biofuel (HVO) |
0 |
0 |
45776 L |
1.45 |
|
Gas |
1786 Kg |
2.05 |
1316 Kg |
1.52 |
|
Waste |
|
|
|
|
|
Recycling |
Not recorded |
|
42.8 tonnes |
0.92 |
|
EfW |
Not recorded |
|
86.1 tonnes |
1.84 |
|
Water |
|
|
|
|
|
Borehole |
Not recorded |
|
200 m3 |
0 |
|
Mains (potable) |
Not recorded |
|
161 m3 |
0.06 |
|
Waste water |
Not recorded |
|
343 m3 |
0.28 |
|
|
|
|
|
|
|
Total |
|
207.55 |
|
88.1 |
|
Visitors |
|
61353 |
|
58182 |
|
CO2 per visitor |
|
3.38 Kg |
|
1.51 Kg |
