The Space Within Boundaries - Julia Wielgus On Using The Carbon Calculator
Julia Wielgus works at Jan Mot, Brussels and is a GCC Travel committee volunteer. Here she gives us an insight into using the carbon calculator:
Jan Mot joined the Gallery Climate Coalition in November 2020 and as part of the commitment completed our first carbon report using the organisation’s calculator.
A carbon footprint can be compared to a portrait, one that is based on actions. By looking at the diagram representing the different sources of CO2 emissions and their percentages, one can imagine how a gallery looks and operates. One might guess that Jan Mot is a gallery that has both a small space and team, often shows conceptual art, rarely transports large volume shipments, doesn’t participate in many fairs, and that its relationships and networks are mainly spread over Europe and the Americas.
The latter, expressed in business travel by air, had the biggest impact on the gallery’s carbon footprint (2019). That long-haul flights accounted for a large share of our carbon emissions was not a surprise and will be the case for many galleries. What we didn’t expect is that it will rise to approximately 70% of our total calculated emissions that year.
Comparing certain data was also revealing, for instance the emissions caused by the shipment of a package of 6 kg from Brussels to Minneapolis by air is equal to a 300 kg shipment of art and equipment by truck from Brussels and the fair in Basel. At the same time a single one hour flight between Brussels and Berlin that can be easily replaced by train travel would cause an almost double emission (0.05 compared to 0.09 tCO2e)!
Working on the report helped us to get a clearer picture of our environmental impact and formulate objectives. The data made us look critically at different areas of our activities - including energy consumption, use and reuse of materials and inspired us to search for more sustainable alternatives. It encouraged us to talk to our suppliers, shippers, and the art fairs we participate in. But it also activated exchanges with colleagues concerning their experiences, research, resources and valuable initiatives. We believe that individual accountability matters and if we all make an effort it will make a difference.
Moving Towards Systemic Change
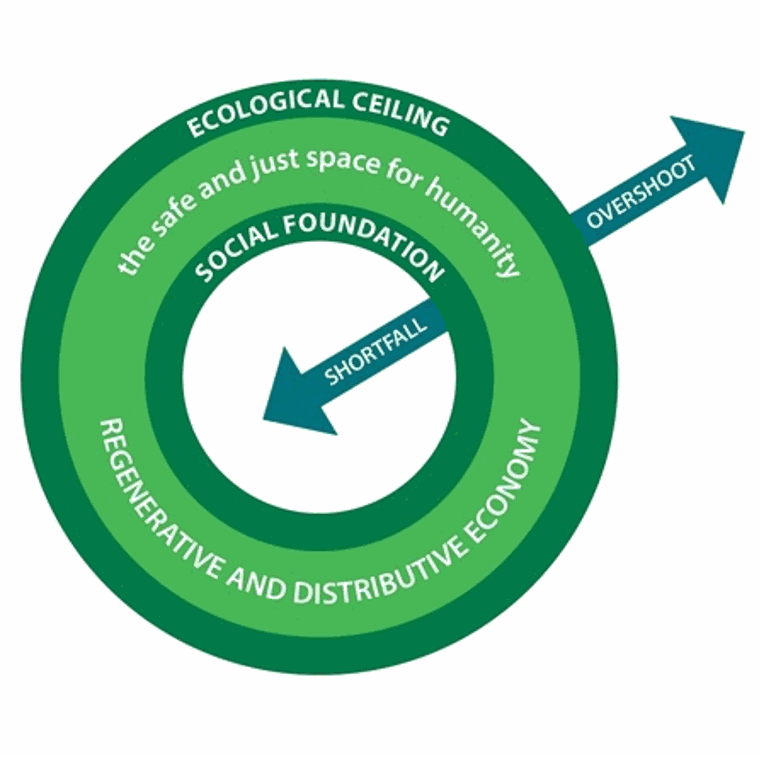
The shape of the audit pie chart generated with the GCC calculator made me think of Kate Raworth’s Doughnut (Doughnut Economics: seven ways to think like a 21st century economist, 2017) and I like thinking about the challenges we face in the art world in terms of the model she proposes. The main idea behind the Doughnut is to meet the needs of all people given the resources of the living planet. The two concentric rings of the Doughnut create an ecologically safe and socially just space in which humanity can thrive. It’s a mindset that could be helpful to rethink and design our activities in such a way that together we create a more sustainable, regenerative and distributive system. Sometimes staying within boundaries requires going beyond.