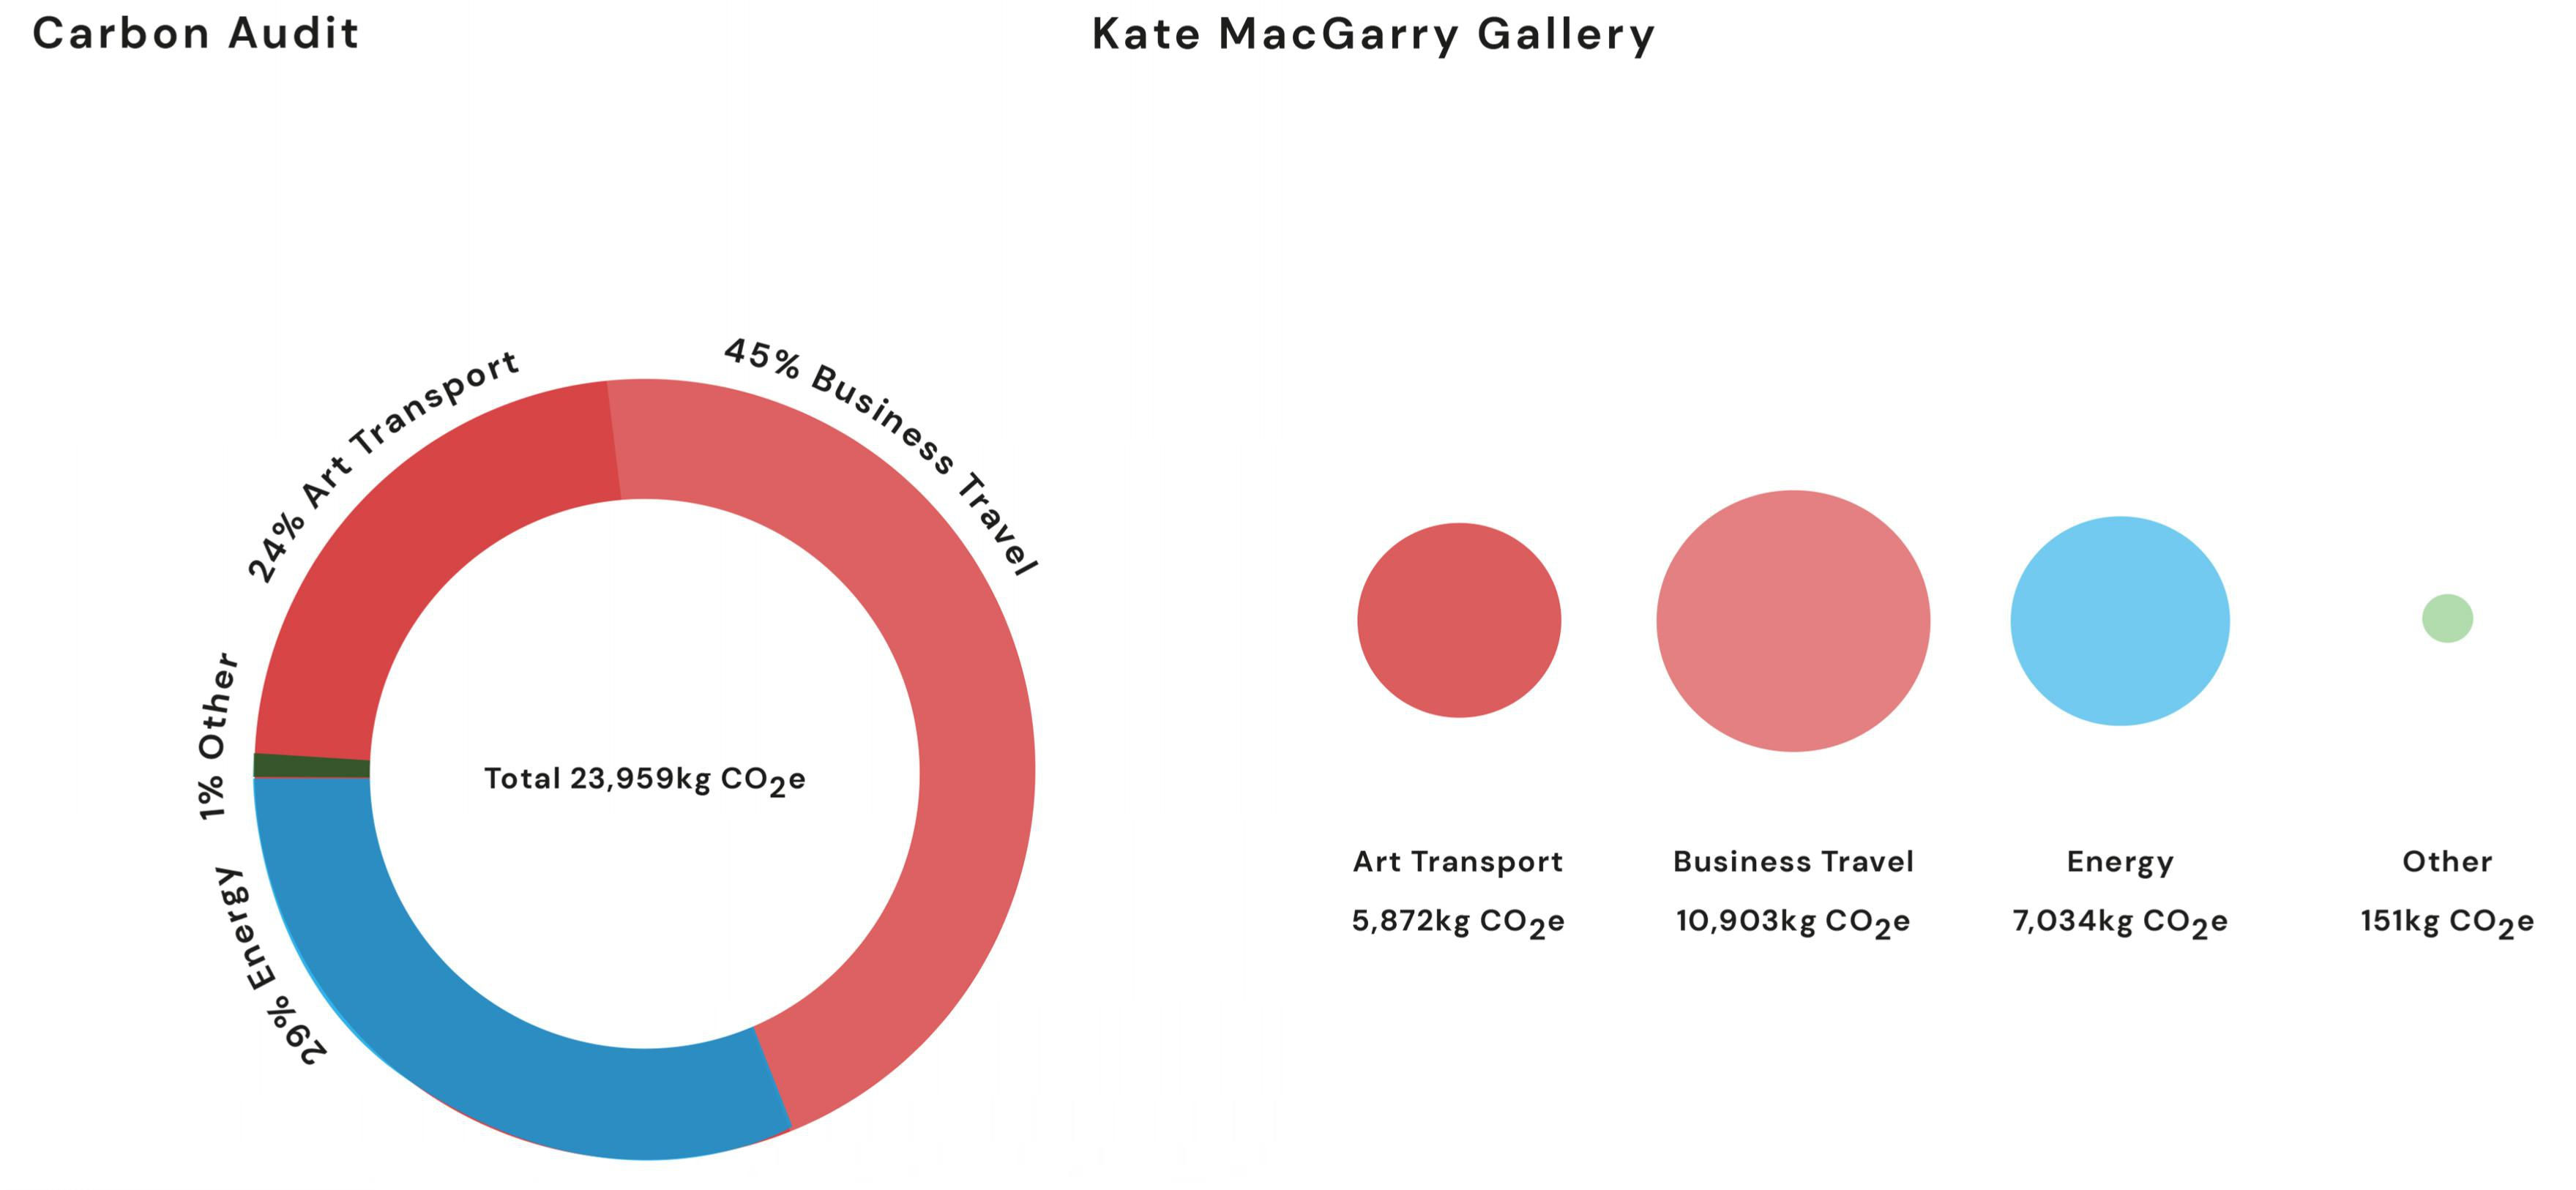
Carbon footprint of Kate MacGarry (London), 2018/19
-
Just three major elements (business flights, the air freight of artworks, and energy use at the London gallery) made up 93% of their 2018/19 carbon footprint
-
Business travel was the largest part of this, with a small number of flights making up a big part of the footprint. Just three return journeys (from London to Shanghai, Dubai and New York) made up 70% of the business flight emissions -- almost 30% of the total annual carbon footprint of the entire gallery.
-
Energy use seemed a bit higher than expected, and worth investigating further.
-
The packaging footprint was unexpectedly low, compared with other industry examples. The gallery is investigating whether in fact extra packaging was used by the shipping companies and not reported to the gallery.

| Detailed Breakdown | tCO2e | % 2018/19 Footprint |
|
Business travel - flights |
10.65 |
44.5% |
|
Gas use at gallery |
4.64 |
19.4% |
|
International art transport - air |
4.57 |
19.1% |
|
Electricity use at gallery |
2.40 |
10.0% |
|
UK art transport |
0.99 |
4.1% |
|
International art transport - road |
0.32 |
1.3% |
|
Business travel - rail |
0.09 |
0.5% |
|
Business travel - car |
0.12 |
0.4% |
|
Packaging - wood |
0.07 |
0.3% |
|
Packaging - plastic |
0.05 |
0.2% |
|
Packaging - card |
0.03 |
0.1% |
|
TOTAL |
23.92 |
100% |
