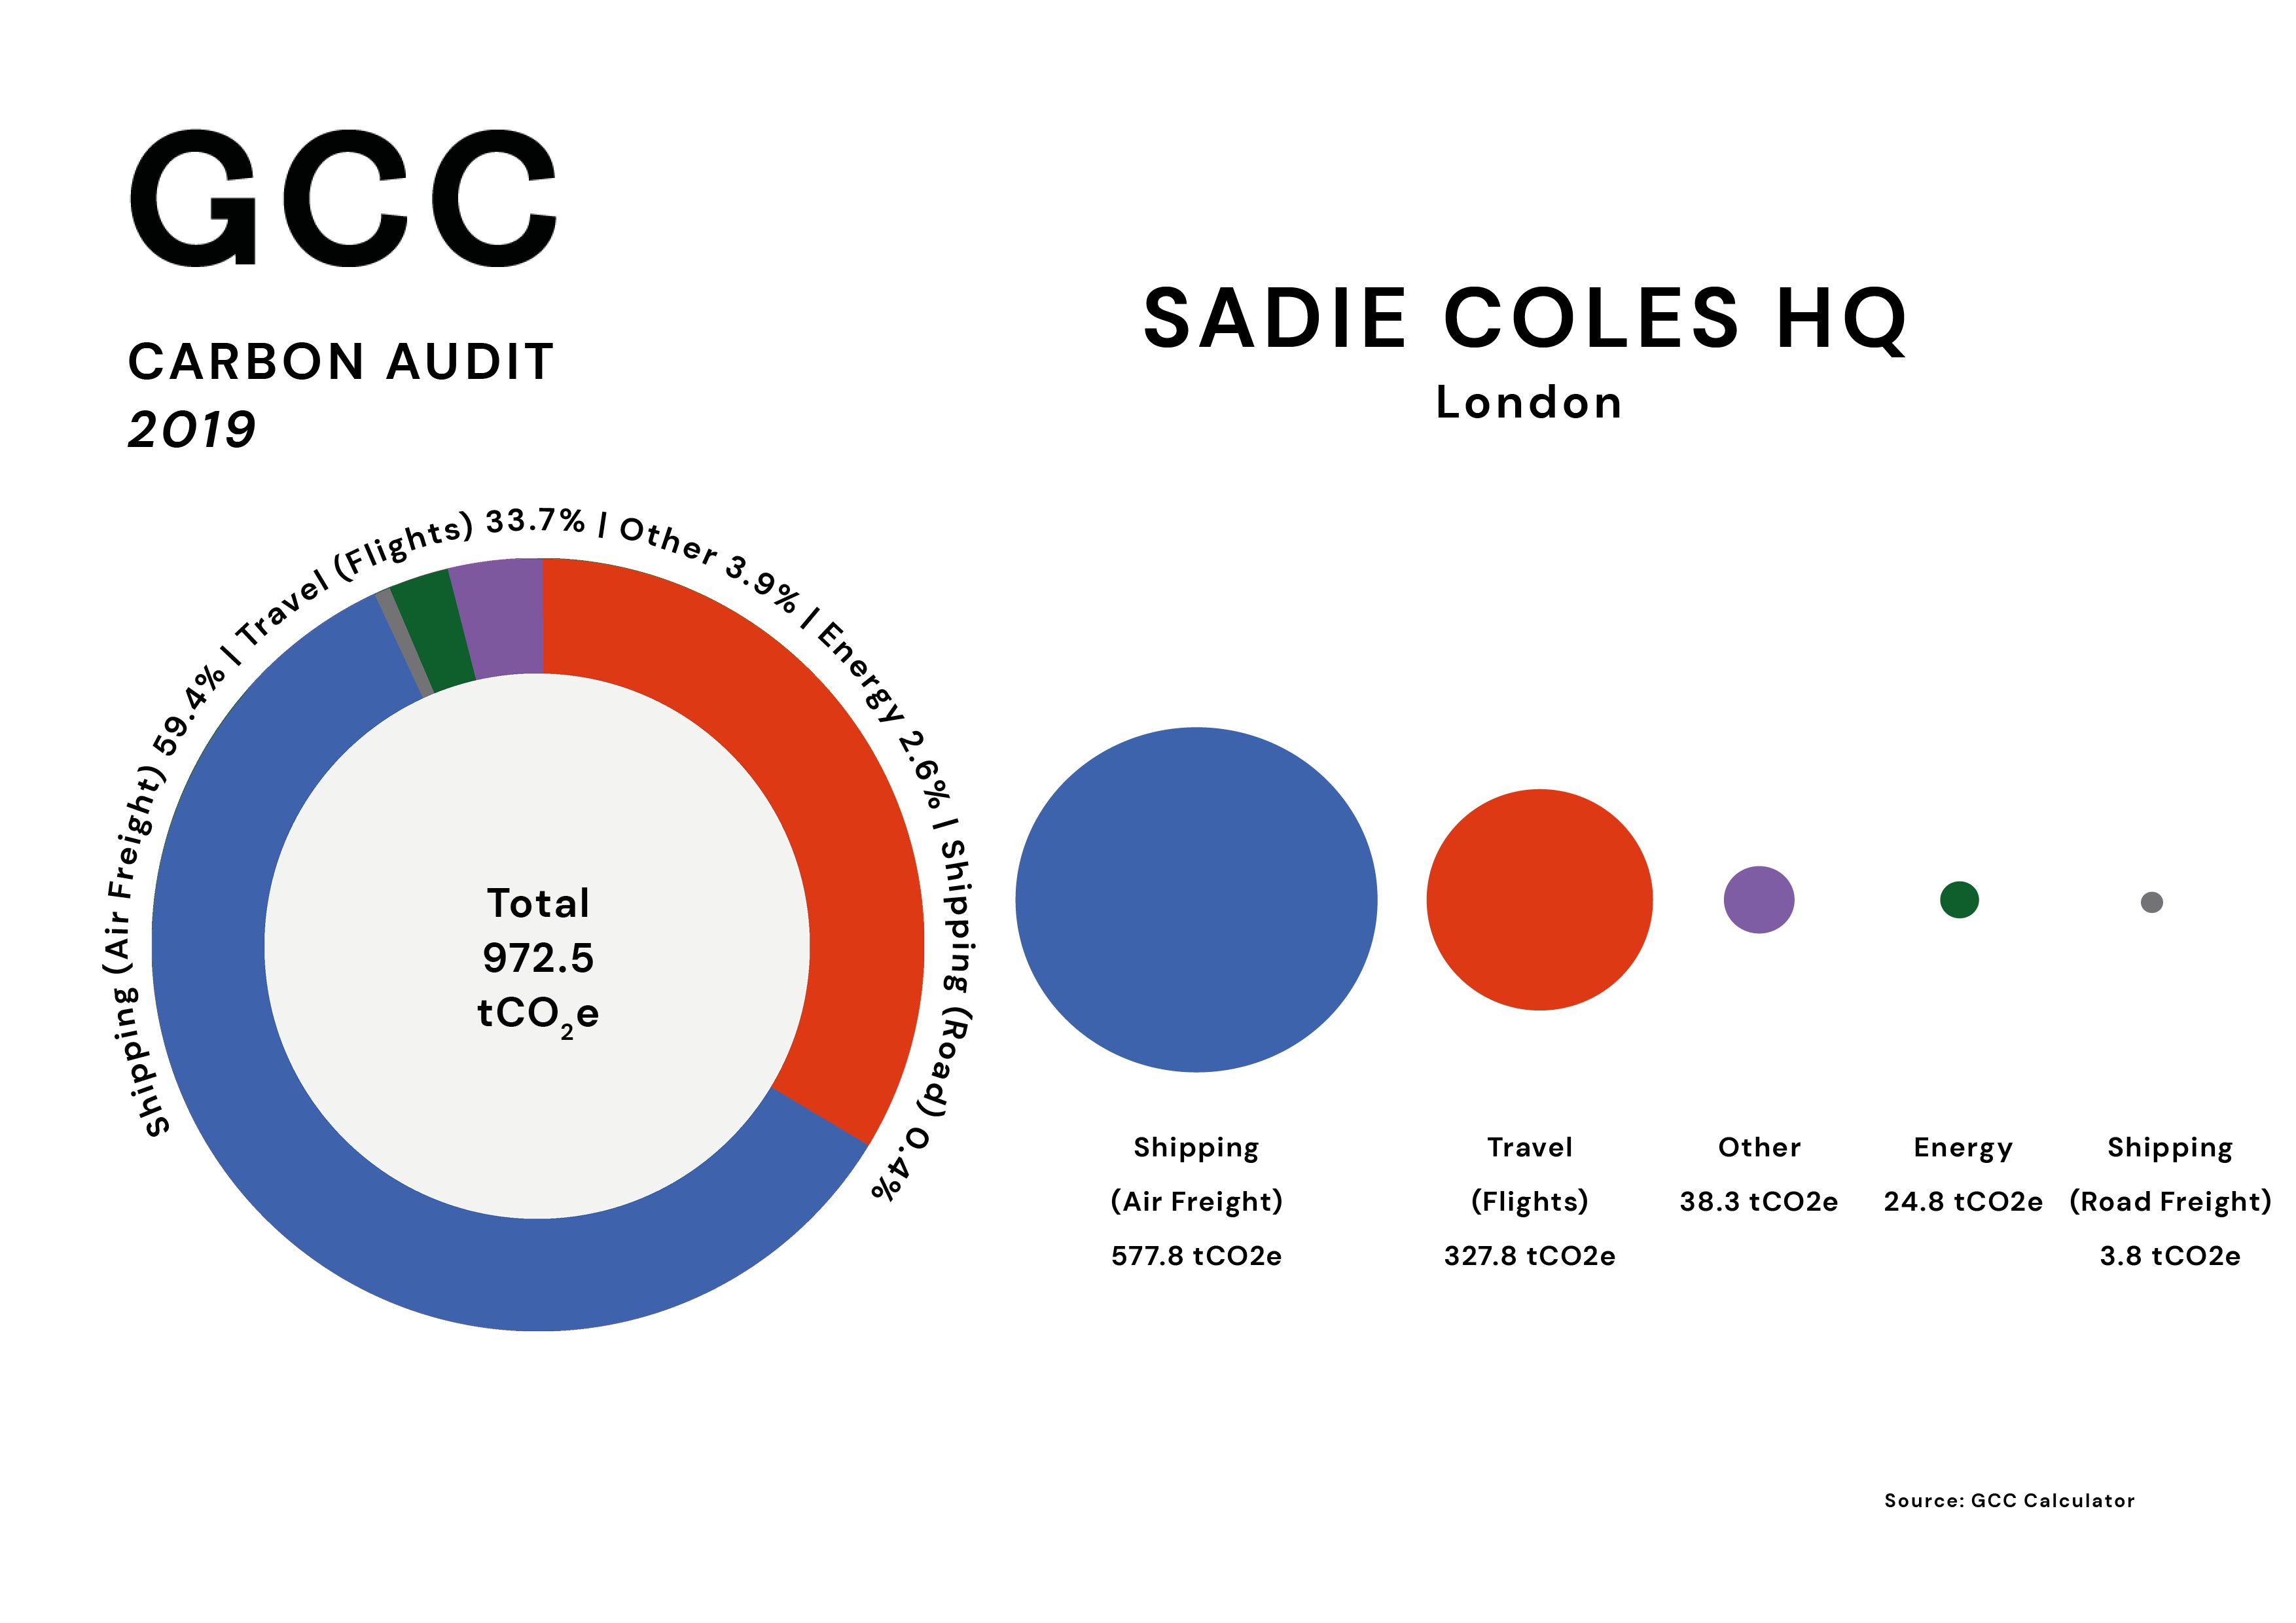
Carbon footprint of Sadie Coles HQ (London), 2018/19
- Information and data collected via a full carbon audit, conducted by a verified consultant.
- The figures for art transport assume that this does not include extra packaging/crating added by shippers. We have used a professional estimate that this crating makes up 30% of the final weight transported and have uplifted the weights accordingly.
- For local art transport, most journeys didn't have any details on the vehicle used, so we've assumed a small diesel van was used in each case.
- No gas was used for heating at the four locations, the only energy used was electricity.
- All ground transport of artworks to and from airports is assumed to be included on the local transport page.
- All air freight journeys are assumed to be direct without stopovers etc.
- For long distance road freight, no vehicle details are given so we are using the carbon footprint of average HGV transport
- Long-distance freight is assumed to include all shipping of non-art items as well
- In addition to the reported packaging purchases, the extra 30% of crating added by shippers has also been included under "packaging". This assumes no re-use of crates, and that this packaging consists of 90% wood and 10% plastic.

|
|
